NetScan
nScan Network Assurance
NetScan is a powerful, flexible network monitoring system that extracts information directly from the control and user plane and makes it accessible in real-time. In addition to full, end-to-end capabilities, NetScan offers continuous monitoring of 100% of transactions in real-time, ensuring that no data is lost or information missed. All transactions in the network are captured, processed, consolidated and stored for real-time or historic reporting. It offers many important features for every mobile operator.
Real-time 24/7, continues network monitoring, processing and data analysis.
Supports fixed and mobile (incl. GSM-R) voice and data networks, from SS7 to LTE – all in one system.
Shared-RAN support (MOCN & MORAN) including secure separation of data between MNO’s involved.
Reach set of pre-defined KPI’s aggregated per cell, project, region, BSC/RNC, roaming partner, terminal type.
Detailed analysis of radio-related problems, incl. unique full Abis coverage.
Network-wide call tracing with down-to-bit message decoding.
Open architecture ready to deploy new features (real time alarming, VIP subscriber care system, Gn, LTE).
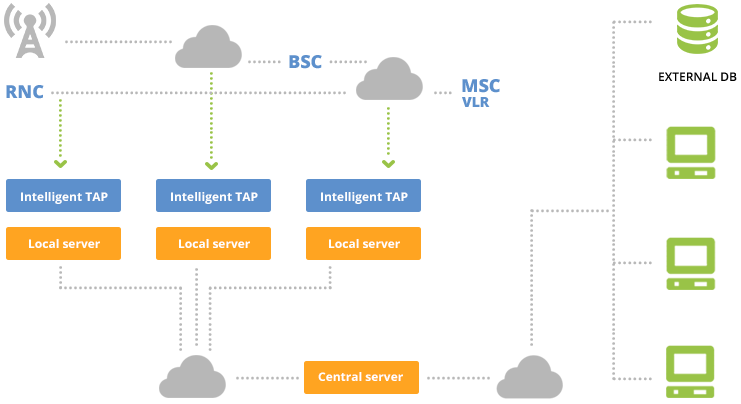
System architecture
Highly distributed, scalable system architecture to cope with high load.
Network signalling monitored through a chain of smart TAP’s feeding local servers with pre-filtered data.
Captured PDU’s are decoded and processed to calculate KPI’s and correlate on various levels.
Multi-interface correlation is supported, including inter-BSC and inter-system HO’s.
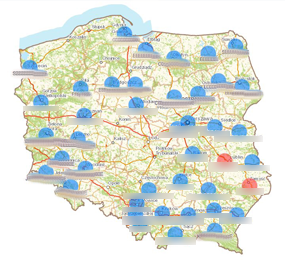
Network status indication
Network status screen visualizes values of statistics with colours indicating violation of statistics pre-defined thresholds.
All elements on screen are active – with single mouse-click one can see statistic details, detailed cell analysis or signalling transaction.
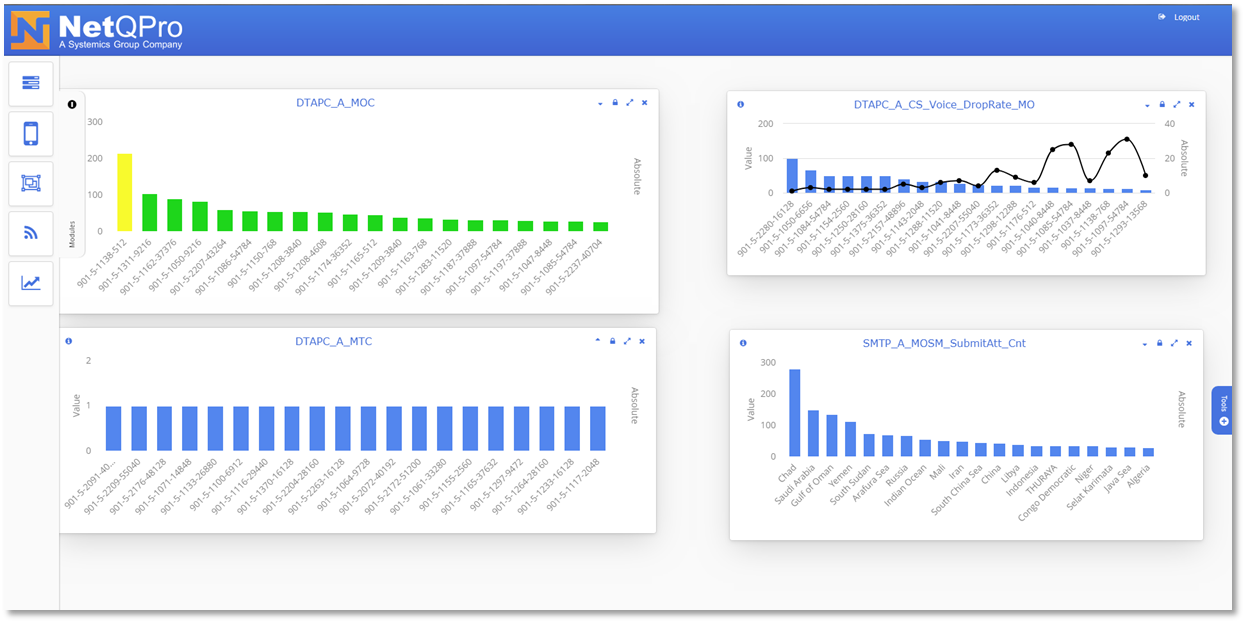
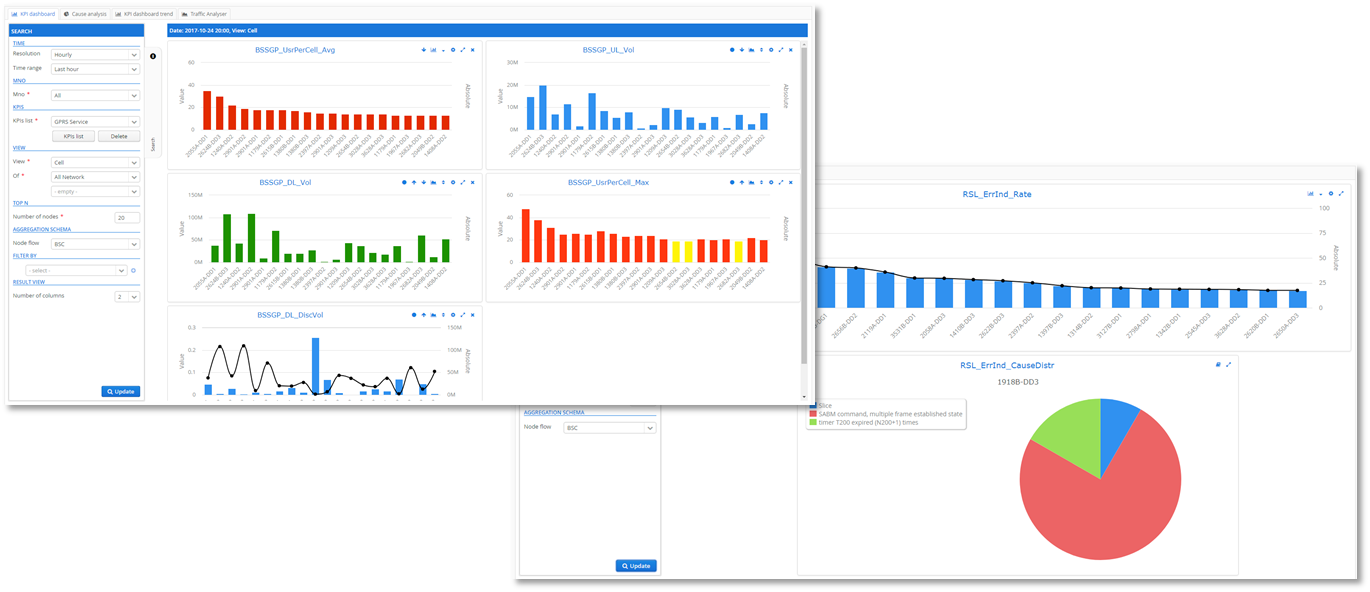
Statistics
400+ KPIs calculated for all major protocols on RAN & Core interfaces
Daily, hourly, 15 minutes … aggregations per cell, region, cluster, etc.
Graphical visualisation of single statistic in many geo- and time contexts.
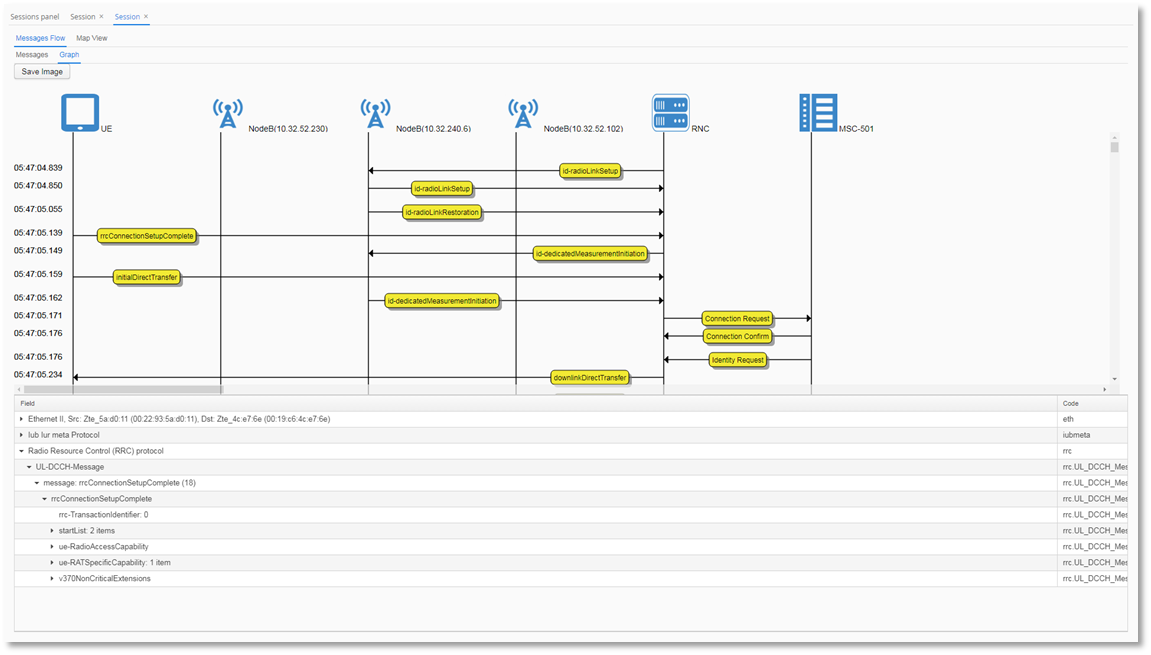
Call tracing
Calls can be analysed both in tabular and graphical formats.
Calls can be traced based on localization (region->project->BSC/RNC->cell), terminal or user identity (IMEI, IMSI, TMSI), selected transaction parameters (termination cause, type of transaction, etc.) or specific events like unsuccessful HO.
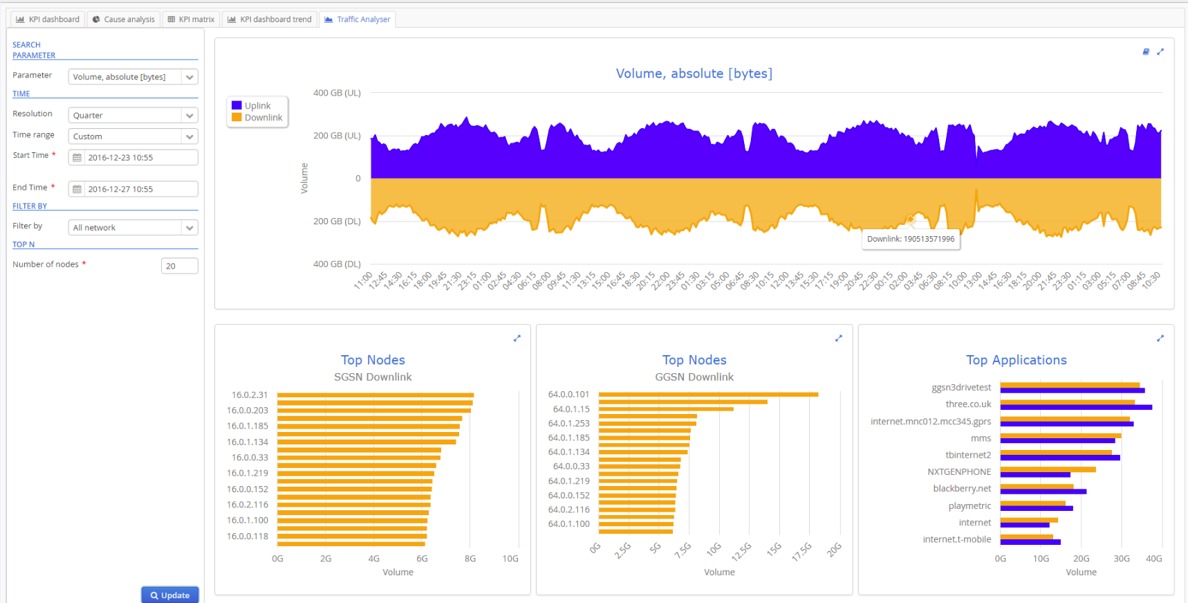
Traffic Analysis
Visualise traffic metrics (volume, bytes/packets sent, etc.) over time
Shows traffic distribution per nodes
Optionally, displays also service/protocol distribution
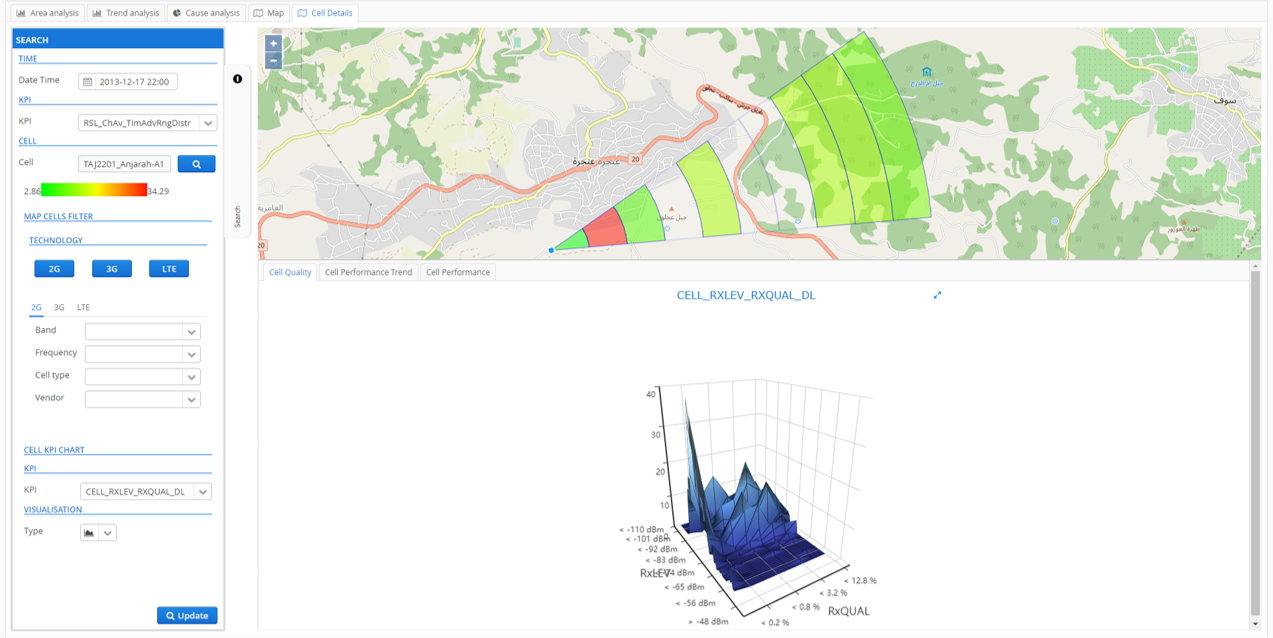
Cell analysis
3-dimensional graphs illustrates correlation between specific measurements reported in MR messages for the selected cell and time.
Do you want to know more?

Head Office
Wołodyjowski 46b
02-724 Warszawa
POLAND
Contact Details
+48 22 424 70 01
netscan@netscan.pl